Cross-Estimate Nomenclatures |
  
|
Cross-Estimate Nomenclatures |
|
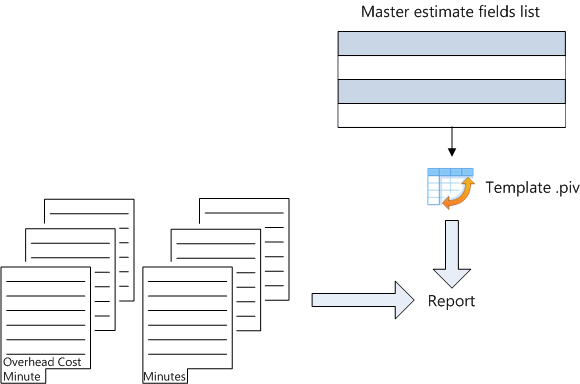
The tool Summarize multiple estimates is used to consolidate the Nomenclatures of several estimates resulting of one master estimate, meaning their fields have the same mnemonics.
Just as Pivot Tables in Excel, it enables you to build a custom summary by presenting the Minutes data according to a layout and consolidation (Σ values) file:
General Procedure
1.Select File>Tools>General>Summarize multiple estimates
2.To create, if the need arises, a template, click New template and select an estimate with common mnemonics: it can be an empty estimate, generally the master estimate of estimates to consolidate. Save this file (extension piv).
3.Select Synchronize with the estimate template; the frame populates with all the fields common to estimates (including the recently added ones); to add a field created later, click the button Synchronize with the template
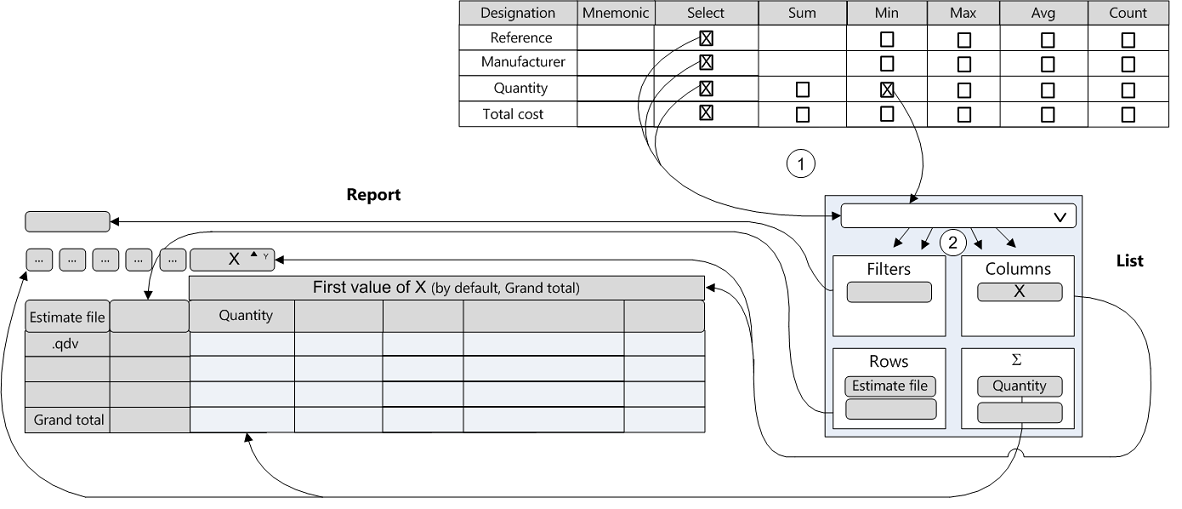
4.Check the boxes of interest
•Select for filtering fields, sorting criteria, totals susceptible to show (for better performance, include as few fields as possible)
•Operators Min, Max, Average, Count of fields across the estimates to consolidate (it is not mandatory to check Sum)
5.Click Save
6.To edit, if the need arises, some values, click Show raw data, then, if the need arises, Show list, and drag-drop a field onto the table (the column colors are those in Nomenclatures)
7.Click Save and Close, then click Show Pivot Grid
8.To select the estimates to consolidate, click Add estimates; for multiple selection, hold down the key Ctrl
9.Click Show list; the drop-down list is populated with the selected fields-operators in step # 4; the operator name is appended to the field name
10.In this list, select and drag-drop the fields-operators of interest to one in 4 areas (phase # 2 in hereunder schematic); the table builds up accordingly, automatically if the box Defer layout update is NOT checked, on demand otherwise (click Update). Other solution: select and drag-drop directly the list fields to the report (the symbol X shows if the destination is not valid, two vertical arrows show if it is)
The report is surrounded by tags. Each tag features a black triangle to expand/collapse the rows, and a funnel to filter according to the values of the related field (slicer).
To change a column width, drag either vertical border (a double arrow shows).
To export the report to Excel, click Export.
NOTE Outside monetary fields, the Count column shows the count of Minutes, and the columns Min and Max are based on the alphabetical order.