Analytical Reports |
  
|
Analytical Reports |
|
Use Case
Business Analytics brings about more complex reporting than regular Reports. In addition to usual tables and pivot tables, analog vizualisations (especially of breakdown) are offered. QDV7 Ultimate comes with a rich library of predefined reports.
General Procedure
Branches |
Fields in Data Source |
|
Report Design (pattern) |
|
|
||
↓ |
↓ |
↓ |
|
|
|||
0 |
1 |
2 |
3-4 |
5 |
6 |
||
WBS & Minutes → |
Click |
Select or Load Selected Fields |
Build Data Source |
Select reports |
Display Report (rendition) |
Save |
→ Report
|
Tools: bar View group Summarize
Applicability: Condensed WBS and Expanded WBS
With the Stimulsoft Business Analytics, the two steps are:
▪design a pattern knows as QDV report, that refers to the data source fields
▪rendition of the pattern with the latest data:
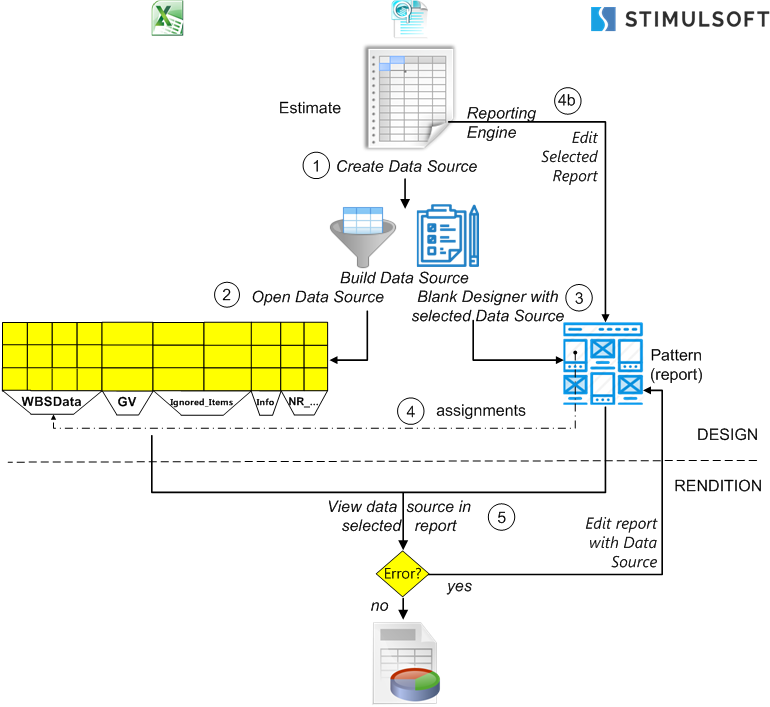
For Excel reports, refer to Designing an Excel Report.
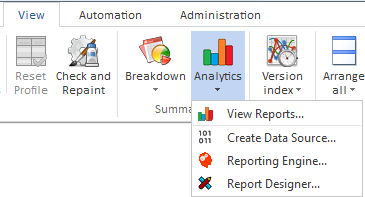
To vizualize the report, click View Data Source in Selected Report.
QDV7 checks that the groups are handled the same way:
▪in the source(s) (selection thru the button Export groups expanded; the value is reflected in the Information tab)
▪in the report (read-only string variable _NeedsCollapsedGroups in the dictionary or the Information tab).
In event of discrepancy, a message pops up and prompts to edit the report.
To edit a report, select it and click the Edit Selected Report button.
Other variable: _NeedsAccurateSellingPrices. If the report uses only costs, set the variable to No to avoid automatically triggering a selling price calculation. For an Excel report, the variable is named _HasAccurateSellingPrices.
NOTE The _Needsxxxxx variables get their values from the box checking in the dialog represented in Building a Data Source (right area). Read these values in the dedicated pane (Stimulsoft) or the Names Manage (Excel) of the populated report or the blank report. They can be edited.
Designing a Pattern or Editing a QDV Report
|
Data source(s) |
|
Values in estimate |
|
↓ |
|
↓ |
|
QDV Report (sample) |
→ |
Populated report |
File extension |
mrt |
|
as saved |
A pattern is a file whose extension is the same as a QDV report (mrt). QDV7 comes with several templates and many QDV report. The templates contain only the layout, while the reports contain, in addition, the QDV field ID assignments.
To create a report/template from scratch, select View>Analytics>Report Designer. Alternative: click the button View>Analytics>Open Blank Designer.
Alternatively, to edit a sample report/template, select View>Analytics>Report Designer>File>Open>Browse and open the folder <QDV installation directory>/QDV 7>Samples>Reports>Analytics>Reports.
Find explanations by hitting F1 (html help) or Select View>Analytics>Reporting Engine>User's Manual for Designer (pdf file).
Themes: file extension is sts.
Managing the Data Sources & Reports
Data Sources & Reports can be added or removed using dedicated buttons.
Selecting Reports (quicker alternative without fields selection for testing)
This procedure runs a macro including a database builder and a report generator. It can apply to all the opened estimates
1.Select either the Condensed or Expanded WBS of the current estimate
2.Select the root in the outline, or, to narrow the report, select a branch or a task; it will be referred to as the Head (item)
3.Select View>Analytics>View Reports; select also the scope ("current position" to focus on the selected item); this opens a manager of private reports (My Reports) and a library of read-only reports (Sample Reports)
4.Select the desired version of the current estimate, and potentially the other opened estimates
5.Select a private or sample report and click the button Build and Display Reports; this builds and displays the report
6.Select Save/<output format> and close the dialog box
7.If the need arises, select another private or sample report and proceeds as in step 2 and 3
8.Click the Close button.