Building a Data Source |
  
|
Building a Data Source |
|
The first step can be detailed as follows:
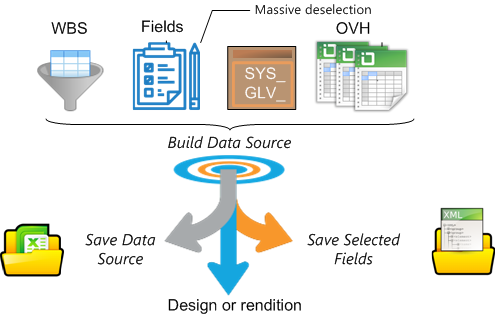
In addition to opening the built data source, ancillary functions are offered.
Selecting Branches & Fields
1.Open an estimate and select either the Condensed or Expanded WBS
2.Select the root in the outline, or, to narrow the report, select a branch or a task; it will be referred to as the Head (item)
3.Select View>Analytics>Create Data Source; this opens an editable workbook featuring two tabs: WBS (that includes two extra columns: Optional? and Take?) and Fields in Data Source (see hereunder illustration)
4.Click the Build Data Source button; this creates a temporary Excel file; click the Reporting Engine button to read its location
5.Click the Close button:
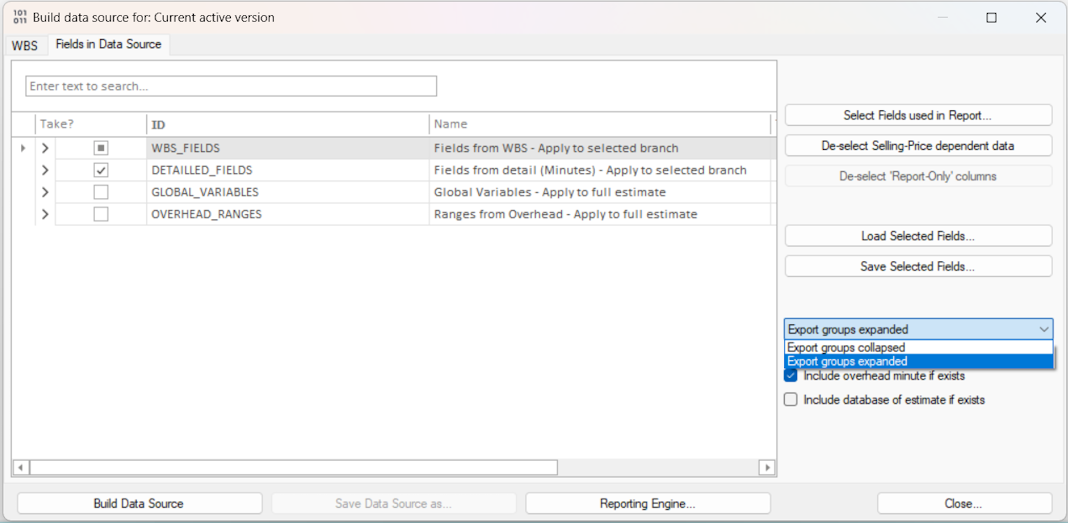
On the left hand (Take? column), two squares nested in each other denotes that some items in the class are selected but not all.
QDV7 shows 4 classes.
WBS_FIELDS: in addition to mandatory columns, specify optional columns to show in the report.
To select all the WBS levels in a given column, check the box in the All Levels? column.
On the left, check the box to add the related column to the data source.
On the right, check the "All Levels?" box, to add a column for each WBS level (n=2 ...8); the heading will be:
▪_0_WBS_Item_Level_n_
▪_6_WBS_Incidence_Level_n_.
Application: creating pivot tables by WBS level.
DETAILED FIELDS:
Check the Minutes fields (whether entered or calculated) to include.
When a fields set is structured in levels (see Creating a Structure), to add a column for each WBS level (n=2 ...8), check the box in the column All Levels?; the heading will be (for MATERIAL):
▪MATERIAL_KindID_Level_n_
▪_MATERIAL_KindID_Descr_Level_n_.
GLOBAL_VARIABLES: to have the possibility of including a variable in the report legend, check the related box.
OVERHEAD RANGES (worksheets): refer to Overhead Sheet Ranges
MASSIVE SELECTION OF COLUMNS
To quickly select the useful fields, click Select Fields used in Report ... and select the report template to use.
MASSIVE DESELECTION OF COLUMNS
To massively deselect the fields that depend on the selling prices, click the related button.
To massively deselect the fields whose insertion is allowed only in the reports (refer to How to Create Free Columns with Custom Behavior), click the related button.
OVERHEAD TASK & DATABASE OF ESTIMATE
Using reports such as Basic_Report_Detailed_Costs, you can show the contribution to the total cost of the overhead task (it does not show in the WBS). For this purpose, check the 'Include overhead minute if exists' box.(See hereabove illustration.)
Reusing Boolean Variables
To save the current field selection, click the Save Selected Fields button. The boolean variables are retained in an xml file whose extension is qdvfldconfig.
To retrieve a saved field selection, click the Load Selected Fields button.
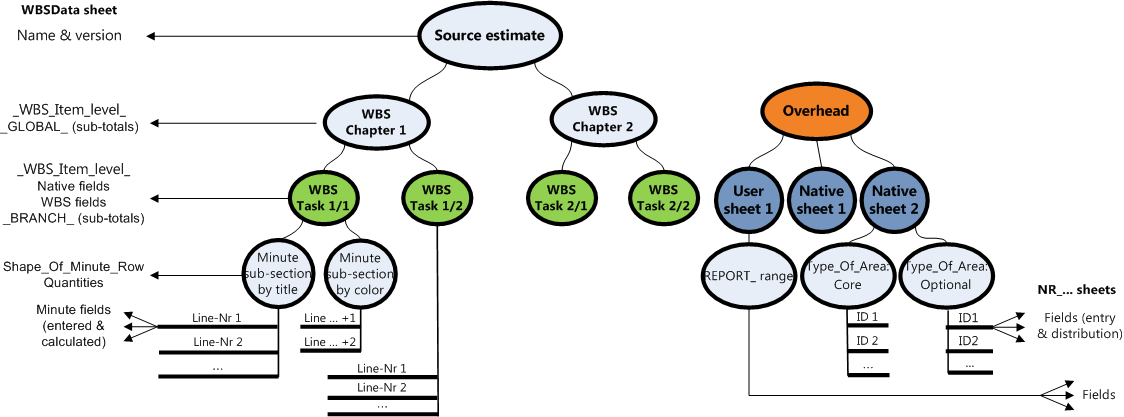
Each spreadsheet is turned into a database: the structure is flattened, that is why
▪the cost and time (and free fields in proportion to quantity and with Sum shown in the total) are split in xxx (x quantity in Minute), xxx_Branch (x quantity in the branch; the optional rows are valued) and in xxx_Global (x quantity in Total amount)
▪there is no total
▪IDs are created.
1.Click the Reporting Engine button
2.Select the data source
3.Click the Open Data Source button; this creates and opens an Excel file with several sheets:
▪WBSData features optional (preceded by _<Column Number>_ as it appears in the WBS column's Properties) and mandatory columns:
- Gantt: includes the column ID_of_Gantt_Task
- Row_Index
- ID_of_Parent_Group which is the key shown in the Planner
- TaskIndex (WBS Hex Id), Minute LineNumber, Shape_Of_Minute_Row which reflects the Minute color (BU for header, initial of color or blank), PositionOnScreen which indicates the rank in the WBS, WBS_Internal_Quantity
▪Global_Variables
▪Ignored_Items: the WBS items declared as Ignored in the Take? column
▪Information: metadata and variables
▪for the Overhead Ranges, NR_xxx,
Close the Excel file to make the dialog box available.
NOTE Each row of the overhead minute and the database of the estimate generates a line with the following values respectively:
0_WBS_Item |
0_WBS_Description |
0_WBS_Description_Level_n |
WBS_Item |
xxxx_GLOBAL |
xxxx_BRANCH |
WBS_Quantity |
TaskIndex |
WBS_PositionOnScreen |
|---|---|---|---|---|---|---|---|---|
– |
– |
OVERHEAD |
Overhead |
0 |
0 |
0 |
ZZZZZZZZZZZZZZZZZZZZZZZZ |
–1 |
– |
– |
DATABASE OF ESTIMATE |
BASE |
0 |
0 |
0 |
YYYYYYYYYYYYYYYYYYYYYYYY |
–2 |
To compare WBS branches, it is possible to select several data sources:
▪the latest created one (temp file)and an older one that has been saved (Save Data Source' button) and added ('Add Data Source' button)
▪several added sources.
When several data sources are checked in the Analytic Reporting box:
▪the Open Data Source button caption turns to Merge and open Data Source
▪the Edit report with Data Source button caption turns to Edit report with merged Data Sources
▪the Blank Designer with selected Data Source button caption turns to Blank Designer with merged Data Source
▪the View Data Source in Selected Report button caption turns to Merge Data Sources to Selected Report.
RELATED REPORTS:
▪Basic_Versions_Comparer
▪Compare_heterogeneous_WBSs.
For several versions (or progress statements) of one estimate, it is quicker to use the View Reports menu item. Refer to Analytical Reports.