Selecting & Editing a Report |
  
|
Selecting & Editing a Report |
|
Selecting a Report
The report library provides a lot of predefined reports, including an invoice model.
A QDV report (Stimulsoft report for QDV7) includes:
▪a layout (grid, whose structure is visible in the designer thru the ribbon Page>Panels>Report Tree)
▪a dictionary of data sources and variables (created in the designer thru the ribbon Page>Panels>Dictionary and right clicks)
▪assignments of fields from the source(s) in the grid.
An Excel report includes sheets with:
▪pivot tables and/or pivot charts
▪data sources (Excel tables, ranges, ...).
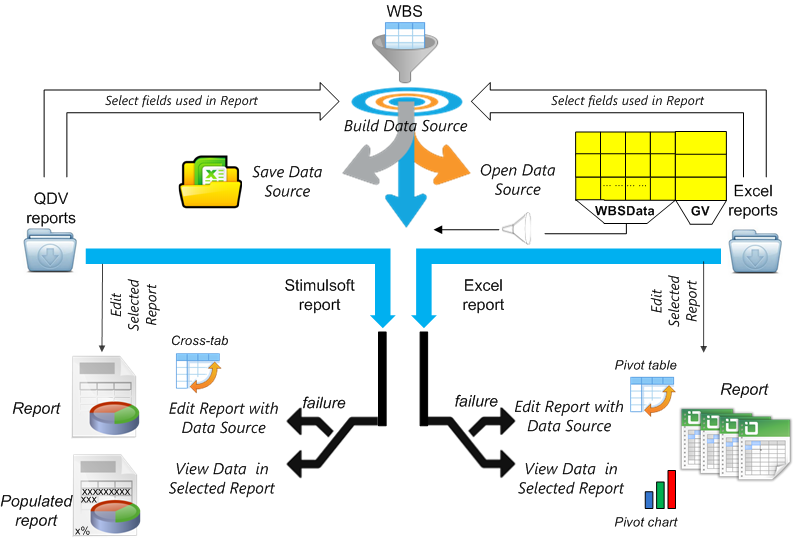
NOTE If using "View ..." produces errors, fix them either with "Edit Report with Data Source" (a source is selected), or with "Edit Selected Report" (no source is selected). For Excel reports, refer to Designing an Excel Report.
Select a report using the manager of private reports (My Reports) and the library of read-only reports (Sample Reports):
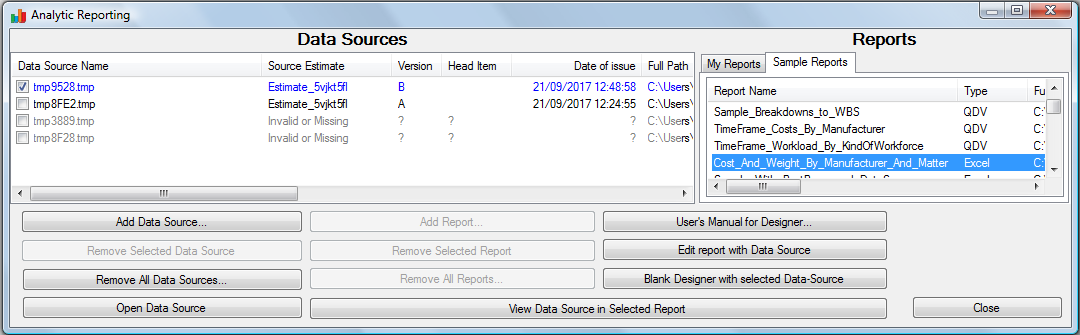
QDV REPORTS:
Sample_Breakdown_to_WBS breakdowns the totals of WBS chapters into kind IDs.
Breakdown_With_TimeFrame breakdowns the times into WBS chapters (start and end dates are selected in the vizualisation). Refer to Time Frame Fields.
NOTE When no data source is checked:
▪the Open Data Source button caption turns to Edit Selected Report (the results are usually identical)
▪the Blank Designer with selected Data Source button caption turns to Open Blank Designer.
Sharing Templates
If you have created in the installation directory a DefaultFolderForReports.inf file stating paths, e.g. X:\Reports, QDV7 does NOT scans the installation directory for templates to show. The mrt and xlsx files with these paths show in the My Reports tab of the windows. Save the new templates in one of these directories.