Designing an Excel Report |
  
|
Designing an Excel Report |
|
The Excel reports are comprised of reporting sheets and sheets belonging to the data source.
On rendition, QDV7 replaces the data in the data source sheets with fresh data coming from the latest version of the data source.
A message is triggered when an invoked column or worksheet doesn’t exist in the data source due to a change in the estimate or the selection for building.
When several sources are selected, they are merged in the source sheets as illustrated:
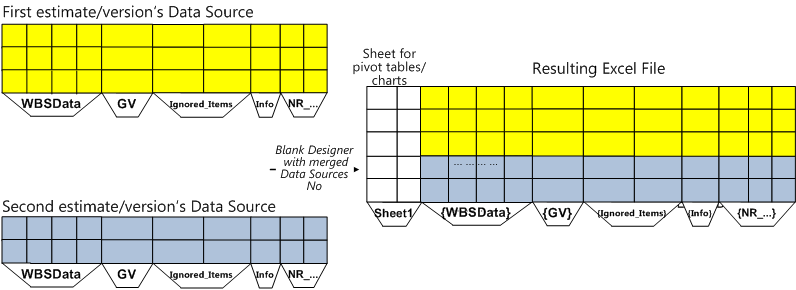
The Data Source sheet names get wrapped with curly braces to avoid confusion.
PROCEDURE
1.To design an Excel Report, it is not necessary to click the Open Data Source button (for several estimates/versions, Merge & Open Data Sources). Just check the data source(s) and click the Blank Designer with selected Data Source button (Blank Designer with merged Data Sources), then No. This opens an Excel file where the Data Source is supplemented with a blank sheet, meant to receive a pivot table or a pivot chart
2.Create the pivot tables and charts as usually (the chart legends can refer to cells in the source sheets)
3.To speed up the renditions, delete the sheets or columns of no use (no copy-paste)
4.To save the report, select the My Reports tab in the dialog box and click Add report.
Alternative: click the 'Edit report with Data Source' button. Don't forget to save the report after edition if you have made a copy (i.e., if you have answered Yes to the message).
NOTE The Excel Name Manager exposes a char string and two boolean fields:
Name |
Value |
Refers to |
Scope |
Comment |
_InitialMacroInvokedByQDV |
|
="" |
Workbook |
|
_NeedsAccurateSellingPrices |
YES |
="YES" |
Workbook |
Edit to prevent QDV7 from calculating the selling prices automatically at the opening even though they are not accurate |
_NeedsCollapsedGroups |
NO |
="NO" |
Workbook |
Take care before editing if some Minutes are grouped |
To run a macro (included in the report) at the very end of each rendition, enter its name, e.g., module1.mymacro(), in the first row's Value and "Refers to" columns.
To flip the boolean fields of an existing report, click Edit Selected Report, and, in Excel, select Formulas>Name Manager. This enables you to adapt a report in accordance with the togglers in 'Fields in source' dialog just before Building a Data Source.
Because pivot tables refer to ranges thru absolute references, a change in the columns frame may result in the 'Reference isn't valid' message. To solve this, open the report under Excel, directly of by editing it from QDV7, and select the pivot table whose reference is wrong. Then click Analyze>Change Data Source, and check the range.
Potential recovery actions are logged in an xml file to be found in Users/<User's name>/AppData/Local/Temp.
Predefined Excel report: Cost_And_Weight_By_Manufacturer_And_Matter breakdowns:
▪the Cost into Manufacturers, then Material Kind Ids using multiple bars
▪the Weight into Material Kind Ids, then Matters using stacked bars.
It requires to check most fields in WBSData and DETAILED_FIELDS, check OVH>Matter, and collapse groups (thru button). Required free fields: MATTER (list), WPU, TTLW (with Sum shown in total).
NOTE To take into account the WBS quantities, drag to Σ Values the MATERIAL_TotalCost_BRANCH field instead of MATERIAL_TotalCost.
It is possible to display only what is useful. This can be done unconditionally or conditionally (that is with IF formulas).
UNCONDITIONALLY
Enter the text {SCANROWS} where the first row intersects a wholly empty column. At each refresh, QDV7 reads the whole column:
▪wherever there is the text {HIDEROW}, QDV7 hides the row
▪wherever there is the text {SHOWROW} or nothing, QDV7 shows the row.
The same applies to columns with {SCANCOLUMNS}, {HIDECOLUMN}, {SHOWCOLUMN} in a wholly empty row.
CONDITIONALLY
One sheet can show only the rows/fields used depending on the result of a test (IF formula).
To hide all the sheet, enter {HIDESHEET} in the sheet A1 cell.