Planner |
  
|
Planner |
|
The time can be a dimension in reports.
Building the Data Source
In Overhead sheets, check Planner Data and Cash Data. With the example below, click Select Fields used in Report ... and select the report Sample_With_PostProcessed_DataSource.
Scrutinizing the Data Source
Sheet in Data Source |
Reflects the estimate's tab |
Includes the columns |
{Gantt} |
Planner |
ID_of_Gantt_Task, Row_Index and ID_of_Parent_Group (key shown in the Planner) |
{NR_Planner data} |
Overhead>Planner data |
Curve_TotalCost that provides the cost distribution curves to be used to plot a cash-flow curve (running total) |
{NR_Cash data} |
Overhead>Cash data |
Date (the table is replaced with a non structured sequence of records) |
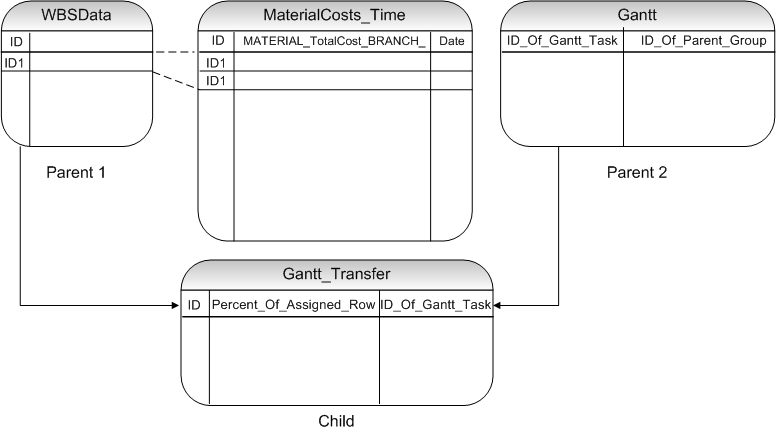
{Gantt_Transfer} |
|
ID_of_Gantt_Task, the IDs of Minutes that invoke the Gantt task |
See diagram hereafter.
CAVEAT
Gantt_Transfer cannot be generated in presence of
▪links between tasks (refer to Links Between Tasks)
▪groups in collapse mode.
Example
The predefined Excel report is Sample_With_PostProcessed_DataSource, that breaks down the Material total costs of the Sample_Planner.qdv estimate by month.
This estimate includes the QDV macro Enhance Data Source With Gantt Breakdown, triggered On_After_Create_Data_Source; this brings up the message "Do you want to add NR_MaterialCosts_Time sheet to the data source?", and, if Yes, the macro appends the MaterialCosts_Time sheet (see diagram below) at the rightmost; due to the unique month column, it is a non structured sequence of records:
NOTE Keep the Material_TotalCost box selected in the 'Fields in Data Source' tab, DETAILLED_FIELDS.
The MaterialCosts_Time sheet is the source of the pivot table in the DataTable sheet; in the Σ Values box is the sum of Material_TotalCost_BRANCH.