Cash Flow Curve |
  
|
Cash Flow Curve |
|
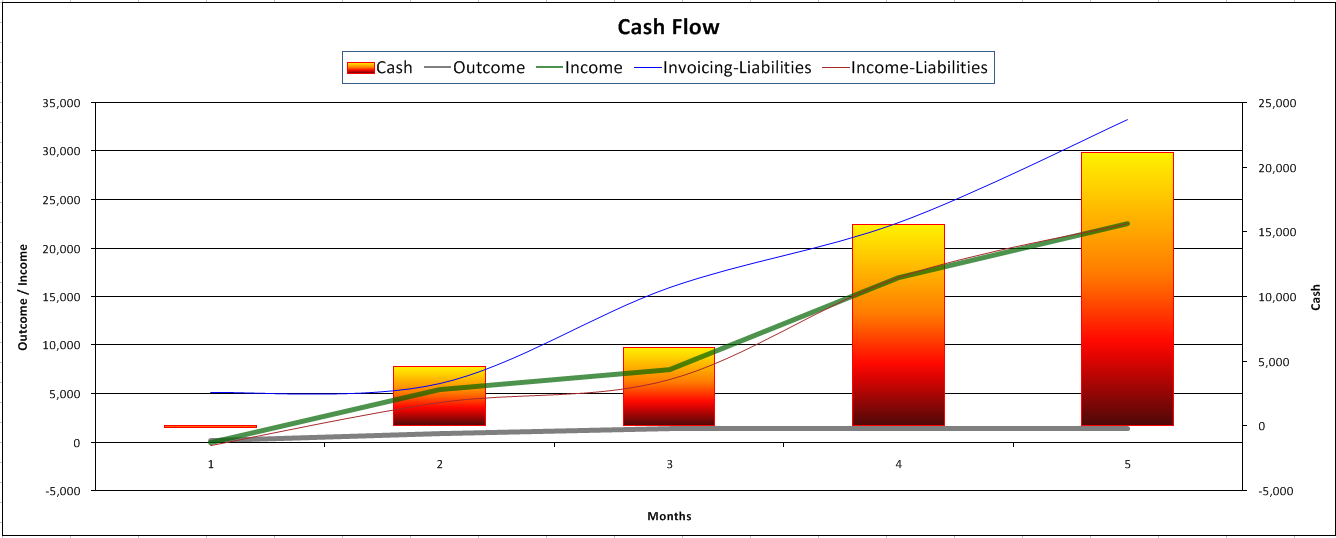
Definition In QDV, the term “cash flow” refers to the curve that represents the difference between the expenses curve (how much and when you need to pay suppliers, e.g.) and the payments curve (how much and when the end-customer pays you). The goal of the function is to know when you have to borrow money and when you should invest excess cash, and then how those actions impact your global costs.
A Cash Flow Curve plots the data of a Cash Data sheet.
To insert in a user sheet a graphic illustrating how the cash flow builds up over time, switch to Edit Mode, select Overhead>Insert Cash Flow Curve (Alternative: right-click and select Insert cash-flow curve) and select the Cash Data sheet used as data source.
The deviations Invoicing - Liabilities and Income - Liabilities can be plotted or not in the cash flow curve.
The count of bars equals the count of months in the Cash Data sheet.
In the example below:
▪the outcome is distributed across 4 installments
▪the income is distributed across 4 installments
Settings are available in the context menu at Chart Explorer:
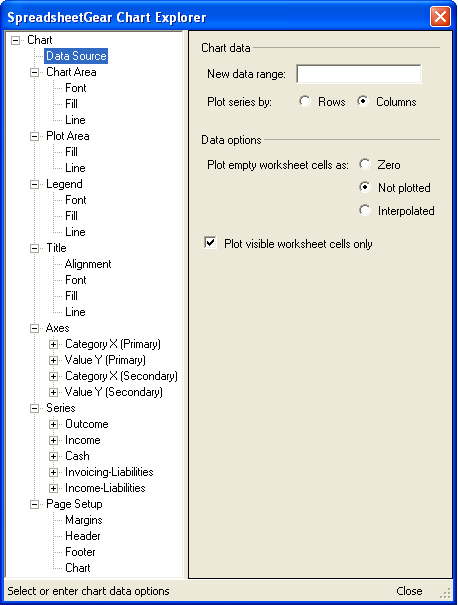
To change the captions, open the nodes Series>X>Data source.