Cash Data |
  
|
Cash Data |
|
The data in the Cash Data sheet are derived from:
▪Planner data sheet when a Planner is used
▪Time frame sheet when a Time frame is used (you need to insert a Cash Data and a user sheet with a Cash-Flow Curve).
When both are used, the data accrue in the Cash Data sheet as you can see on the right:
PLANNER DATA |
|
|
|
|
|
|
|
|
|
|
|
|
|
|
|
|
|
|
|
GANTT TASK |
Info |
|
|
|
|
|
|
|
CASH |
FLOW |
DATA |
|
1 |
2 |
3 |
4 |
|||
|
Start date |
Duration |
Total Cost |
|
|
|
|
Liabilities |
Start Date |
Duration |
End Date |
Core Estimate |
|
|
|
|
|||
|
|
|
|
|
|
|
|
Studies |
|
|
|
|
|
|
|
|
|||
|
|
|
|
|
|
|
|
Purchasing equipment |
|
|
|
|
|
|
|
|
|||
Core Estimate |
|
|
|
|
|
|
|
Cat 1 |
|
|
|
|
|
|
|
|
|||
Studies |
|
|
|
|
|
|
|
Outcome |
|
|
|
|
|
|
|
|
|||
Purchasing equipment |
|
|
|
|
|
|
|
Studies |
|
|
|
|
|
|
|
|
|||
|
|
|
|
|
|
|
|
|
Purchasing equipment |
|
|
|
|
|
|
|
|
||
|
|
|
|
|
|
|
|
|
Cat 1 |
|
|
|
|
|
|
|
|
||
|
|
|
|
|
|
|
|
|
Additional Liabilities |
|
|
|
Amount to distribute |
|
|
|
|
||
TIME FRAME DATA |
|
|
|
|
|
|
|
Additional Outcome |
|
|
|
Amount to distribute |
|
|
|
|
|||
ID |
Name |
Total Time |
Total Cost |
Period |
|
Invoicing |
|
|
|
|
|
|
|
|
|||||
Sub period |
Sub period |
Sub period |
Sub period |
|
Income |
|
|
|
|
|
|
|
|
||||||
Core Estimate |
|
|
|
|
|
|
|
WORKFORCE/IDs |
|
|
|
Total time to distribute |
|
|
|
|
|||
Cat 1 |
|
|
|
|
|
|
|
|
|
|
|
|
|
|
|
|
|
||
|
|
|
|
|
|
|
|
|
|
|
|
|
|
|
|
|
|
|
|
To plot over time the financial flows for the various Gantt tasks (and/or time frame column if an x has been entered in a Time frame sheet) and subsequent charges or revenues, insert a Cash Data sheet.
It is is a free sheet whose preset frame shows as soon as a Cash flow Curve is inserted.
The tasks are sorted according to the Start date. The Material and Workforce contributions are consolidated and rounded.
For the amounts with the value Cash/List in the row "Take in Cash Flow Curve" of the Planner Data sheet (and/or x in a Time frame sheet), this sheet spans across the tasks and along the months the Liabilities (positioned in the month when ordered products are expected) and Outcome Cash outlay related to purchase of supplies and services.
|
|
|
Total amount |
Month 1 |
Month 2 |
Month 3 |
... |
Planner : Spread-out planner data |
LIABILITIES |
Tasks in Gantt |
|
C |
|
|
|
|
|
|
A |
|
|
||
OUTCOME |
Tasks in Gantt |
|
|
|
S |
|
|
|
|
|
|
|
H |
||
Cash: New data (or link to Sheet of Sales) |
ADDITIONAL LIABILITIES |
New cost centres |
|
|
|
|
|
ADDITIONAL OUTCOME |
New cost centres |
|
|
|
|
|
|
INVOICING |
Installments |
|
|
|
|
|
|
INCOME |
Installments |
|
|
|
|
|
|
Cash-flow |
Interest rates |
|
|
|
|
|
|
Resources (optional) |
LIST OF RESOURCES |
Trades |
|
L |
I |
|
|
|
|
|
|
S |
T |
The 'Shifts in payment' of Planner Data sheet account for a deferral between Liabilities and Outcome. As a month may have more or less than 30 days, a deviation may appear.
To expand further the covered extent of time when data come from a planner, use the left upper corner list. To add nothing after the latest expense, select the corresponding option AND check the Strict box.
To take into account the Options, check the Include Optional Area box.
NOTE In the Liabilities and Income areas, when all the values in a row equal 0, the row is visible only in Edit mode.
![]() A simpler way for small estimates is to replace the costs with the selling prices in the Planner Data and subtract the margin in the Cash Data.
A simpler way for small estimates is to replace the costs with the selling prices in the Planner Data and subtract the margin in the Cash Data.
If a Time frame is used with a sub period other than month, QDV7 spreads the amounts equally across the related months.
When a Time frame features more than 20 years, the remaining costs, quantities or times are aggregated in the very last period of cash-flow data sheets.
The ADDITIONAL LIABILITIES and their installments are entered here, and result in ADDITIONAL OUTCOME to which financial charges may be added.
The INVOICING depends on the project terms of payment, which are entered here together with potential deductions, and result in INCOME to which grants and financial revenues may be added.
QDV7 automatically creates Ranges names for each section when you refresh the sheet.
To insert these centers, switch to Edit Mode, select a green row, right click and select Insert Row(s). The descriptions and amounts may come from the Sheet of Sales thru formulas.
The allowed actions depend on permissions about rows:
▪Editing: assigning the distribution curve, selecting the method for spreading amount
▪Editing + Row handling: inserting and deleting rows.
TIME SPANS
QDV7 numbers the months starting with the planning start to n months after the latest outflow (select n in the drop-down box):
|
|
|
|
|
|
← |
extension |
→ |
Ultimate limits |
1 |
2 |
3 |
... |
last expense |
... |
... |
last month |
Current row limits |
← |
← |
Start |
|
|
|
|
→ |
|
|
|
← |
|
Duration |
|
→ |
|
If you set a duration beyond the ultimate time span (last expense month + selected extension), QDV7 stops the distribution at the last visible month.
If you set a starting month later than the last month, QDV7 assigns the whole sum to the last visible month.
SPREADING RULES
The amount above are spread out over time according to rules.
Thru context menu:
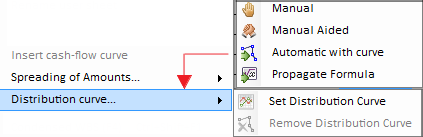
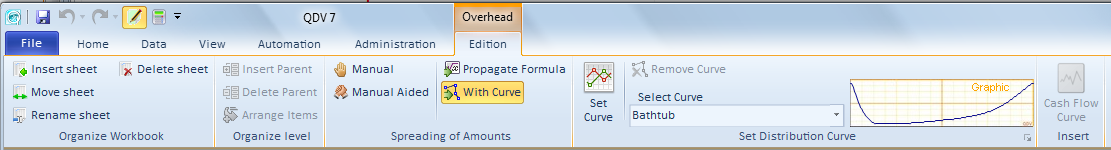
To make a cell editable (green color), switch to Edit Mode, click Overhead>Spreading of Amounts (Alternative: right-click it and select Spreading of Amounts) >
▪Manual: all month's columns are editable
▪Manual Aided: enter the amount for each month; the first month's amount is calculated to get the balance
▪(Automatic) with curve: right-click in the column Curve Mnemonic and select Distribution curve>Set Distribution Curve (alternative: type the mnemonic as in Planner Data), then select a start period and a duration. QDV spreads the amount accordingly. You can create/reuse Custom Distribution Curves
▪Propagate Formula: only the first month's amount is editable (formula with relative references generally), as the others take the same formula:
Spreading mode |
Amount to spread out |
Curve Mnemonic |
Month #1 |
Month #2 |
... |
Manual |
Σ month |
|
|
|
|
Manual Aided |
|
|
supplement |
|
|
Automatic with curve |
|
QUADRATIC |
quota |
quota |
quota |
Propagate Formula |
Σ month |
|
=.............. |
=.............. |
=............ |
CAVEAT The first entry mode is not recommended if the count of months may change.
NOTE An amount can be entered thru a formula in any mode.
SHIFT BETWEEN EXPENSES/REVENUES & FINANCIAL FLOWS
The cash-flow changes when the payments fall due.
The deferrals between additional liabilities and additional outcome in the one hand, and invoicing and income in the other hand are set in the Payment Period column.
The algorithm is illustrated below with 4 months on the abscissa and amounts on the ordinate:
- the invoicing is spread out over 3 months
- the Payment Period shifts the income by a month
- a grant (grayed) is spread out using a linear curve over the 4 months and adds to monthly income (admittedly, there is no financial revenues):
|
2 |
3 |
4 |
5 |
Total Invoicing |
|
|
|
|
Am |
ount |
|
|
|
|
|
|
|
|
→→ |
|
|
|
|
Payment Period |
→→ |
|
|
|
|
→→ |
|
|
|
Total Income |
||||
|
|
Amount |
||
|
||||
FINANCIAL CHARGES OR REVENUES FEEDBACK
Overall Cash Flow = Cumulative Income - Cumulative Outcome. Whether it is positive or negative, it generates an interest or a financial charge.
For each month, the amounts are fed back to Income/Outcome based on a rate.
The rates can depend on the result thru a formula.
In the above Planner Data sheet and/or in Time Frame Sheets, the value List is used to show in the bottom of the Cash Data sheet how the resources evolve over the months, especially the Workforce resources distributed across trades:

Depending on the marked column in the Planner data or <Time frame> sheet, the Sum column features a total time or a net cost.
To show escalated data, refer to How to Create Time Frame Fields.