How to Create Time Frame Fields |
  
|
How to Create Time Frame Fields |
|
Use Case
It happens that the costs (material), or time per unit and time rate (workforce) are modulated over time. Then it is necessary to schedule the time into epochs.
Several epoch-specific columns substitute for the single column in the minutes view (cost or time per unit) or overhead workbook (time rate). Special Kind Ids substitute for/supplement those defined in the Material and Workforce overhead tabs.
The related totals per task can be viewed in the WBS in an extra column.
Time frame fields can be used with or without a planner: the planner defines durations which time frame fields can break down according to the variations of costs/rates.
Creating the Frame
To add a time frame:
1.Click Administration>Fields Manager of Minutes
2.Select the Time frame fields tab
3.Click the New field button
4.Type in the Mnemonic (no spaces, nor special chars) and Field name as you would do for specific sets (they substitute for MATERIAL/WORKFORCE)
5.Click OK; this closes the dialog box
6.Repeat the steps #1 and 2; the new row's third cell now embeds a Column-editing button
7.Click it and select the options as per the 'Defining the Frame" hereafter section
8.Click OK.
Defining the Frame
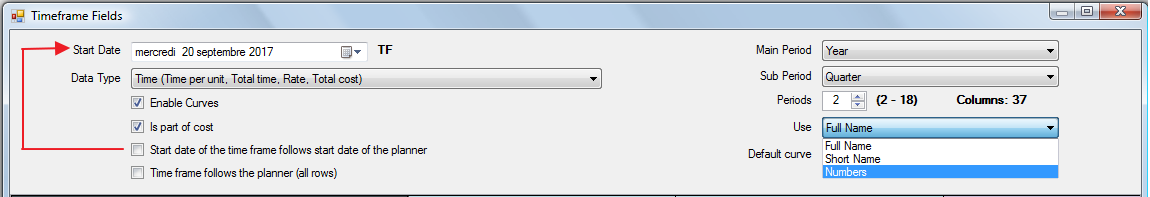
1.To define the headers, select the Data Type:
▪Time: to enter Time per unit, Total time, Rate, Total cost
▪Costs: to enter directly Cost per unit, Total cost
▪Flexible: to enter costs, times, quantities (workforce expressed in quantity instead of time) depending on the rows
2.To take into account the costs resulting of your time frame in the global cost of the overhead, check the box Is part of cost. Otherwise e.g., to use your own formulas, do not check the box
3.To build the time frame, select the Start Date using the date picker (alternative if a planner is defined: follow the planner start date), the Main Period, the Sub Period and the count of Periods. The count of columns shows accordingly; the time divisions succeed starting from the first sub period
4.To narrow the frame (here, but also in the overhead workbook and minutes view), select Short Name or Numbers in the drop-down list Use
5.To implement another computation model across the columns, click Apply, then the "Detailed settings of columns" bottom button (this may require to click OK and click again Column-editing); this brings up the table of fields that can be set (widen the column Formula if needed)
6.Click OK; this inserts a tab similar to Material/Workforce tab in the overhead workbook:
TF Summary |
TF Time, Cost or Quantity p. unit Year 11 |
TF Time/Cost/Qty p.unit Y12 |
TF Total time Y11 |
TF Total time Y12 |
TF Rate/Factor Y11 |
TF Rate/Factor Y12 |
TF Total cost Y11 |
TF Totalcost Y12 |
|||||||||||||
Total time |
Total cost |
Cost Only |
Q4 |
Q1 |
Q2 |
Q3 |
Q4 |
Q1 |
... |
Q1 |
... |
Q1 |
... |
Q1 |
... |
Q1 |
... |
Q1 |
... |
Q1 |
... |
|
|
|
|
|
|
|
|
|
|
|
|
|
|
|
|
|
|
|
|
|
|
The contribution to the costs and selling prices differs from the one of the Material/Workforce:
Control to use to contribute to the |
Material/Workforce |
Time frame field |
Cost |
– |
'Is part of cost' box |
Selling prices |
Overhead drop-down list set to IS FUNDINGS |
user-defined computation |
If the 'Is part of cost' box is NOT checked, the time frame is NOT automatically taking into account in the Minutes calculations and is used only for comparison purposes.
The Total Cost is consolidated in the WBS and in the Overhead Summary sheet (distributed in Material and Workforce), but detailed in the Breakdown (Summary):
Material |
Breakdown Material Amount |
Overhead Summary sheet Material COSTS |
Material in time frame |
Breakdown Material Time Frame Total Cost |
|
Workforce |
Breakdown Workforce Amount |
Overhead Summary sheet Workforce COSTS |
Workforce in time frame |
Breakdown Workforce Time Frame Total Cost |
|
|
WBS Total Cost |
|
The same applies to Total Time or/and Total Quantity (type = flexible).
To prevent non-administrators from editing these data, use a built-in function (refer to Built-in Function Button).
NOTES
- Maximum count of main periods: 75
- To adopt the planner time frame, check the 'Time frame follows the planner' box (for the Minutes without task in Gantt, the input will be manual); it is incompatible with
▪the Enable Curves box
▪the Database of the Estimate function if the Gantt is not controlled by the Minutes and the database of the estimate (see Calculation options)
▪the Linked tasks function (see Links Between Tasks) if the Gantt is not controlled by the WBS or WBS + Minutes
- Swapping the Data types Time and Costs after the step #6 resets the related overhead sheet and columns in the minutes view
- In the formula editor, each column has its own mnemonic: <generic mnemonic> | <rank in the time frame>
- For other attributes, refer to How to Create Specific Set of Columns with Custom Behavior- MT/WF
- You can redefine the Start Date and count of Periods later in the related overhead sheet
- The maximum count of columns (including basic columns) is 1023 in the whole that is 1008 columns in the time frame. If the main period is year and sub period is month, this allows an overall period of 28 years (28 x 12 x 3 = 1008 + base columns; 3 is the count of sets of columns in the Flexible option: Times, Quantities, Costs)
- If the sub-period is quarter and the time-frame does not start at a quarter beginning, then the distribution of values may be incorrect.
Specific to Flexible Data Type
This type features Summary specific fields explained in Time Frame Sheets:
▪Cost only
▪No escalation.
By default, the quantities are
▪absent from the Minutes view 'Total times or Quantity' columns
▪escalated in the Time Frame sheet of the overhead workbook
▪not escalated in Listed Resources table of Cash sheets.
Three cumulative options are offered:
▪For a Quantity type, show escalated quantities in the (time frame sheet and) minutes
▪For a Quantity type, show escalated quantities in listed resources of cash-flow data sheets
▪Display quantities in the 'Total times or Quantity' columns in minutes (not only times).
As of the last option, the quantities are escalated or not, depending on the 'No escalation' flag value. For the Minutes view, this option is less compelling than the first one.
Curve (option)
To fill the rows in the Minutes view using curves, check the box Enable Curves and select the default curve in the drop-down list; this adds columns in the summary; the same columns are used in the Minutes view to define the distribution on a Minute basis:
▪Curve: distribution law over time
▪Start Period: sub-period from where the distribution starts (rank in the time series)
▪Duration: count of sub periods (decimal numbers are allowed)
▪Instruction: amount to distribute; by default, it is freely entered, but generally you must enter a formula that equals it to the quantity or to the time per unit as in the workforce section.
You can define a curve or set a predefined curve. That populates the cells of the row according to the curve. The default curve is assigned to all rows with an instruction different than 0.
This default curve is assigned at the latest at cost or selling price calculation, but in many cases earlier (e.g. at edition of instruction in Minutes, at calculation of instruction, etc…).
If the count of periods given results in exceeding the maximum size of the time frame, the time frame takes the maximum size and nothing is lost in the amount provided in the Instruction column.
Input in the Overhead workbook
Refer to Time Frame Sheets.