Custom Distribution Curves |
  
|
Custom Distribution Curves |
|
Use Cases
▪Distributing the costs in the course of time when a Planner is used (Planner Data sheet)
▪Distributing the costs in the course of time when Time Frame Sheets are used (How to Fill the Time Columns)
▪Distributing the additional liabilities and outcomes in the course of time when a Planner or Time Frame Sheets are used (Cash Data sheet).
Procedure
For out-of-the box curves, refer to Planner Data.
The capability of tailoring curves is subject to security setting (Create and modify curves).
Applicability: Edit mode of Overhead workbook, and Minutes with Calendar.
To create your own curve from scratch:
1.Select New curve
2.Select the way to create it:
▪Points: to create a piecewise characterization, enter pairs abscissa (time since the tasks started) – ordinate (relative quota) both between 0 and 100; abscissas 0 and 100 are mandatory
▪Relative %: to create a stepwise characterization (i.e. you assign shares of the amount to time slots), proceed alike; QDV7 creates two points per abscissa; the sum of ordinates must be 100%; otherwise, QDV7 computes new ordinates accordingly; abscissa 0 is mandatory: QDV7 assigns to the abscissa 100 the same value as the largest entered abscissa
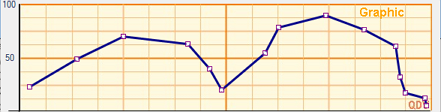
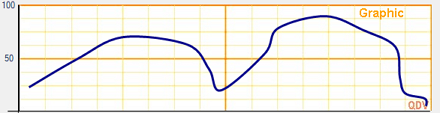
▪Graphic: click on the diagram as many times as you need nodes; to smooth it, select Curve in place of Lines
3.To edit a curve Points or Relative, click the graphic
4.Click Save Curve As; then the new curve is enrolled in the list as Owner i.e.custom; it belongs to the current estimate.
To edit an out-of-the box curve, select it and click Edit curve; the table or the anchoring points show. After edition, click Save Curve As.
Period of time (abscissa): full duration defined in the row where the curve is used. In the Planner data sheet it is the duration of the task in the planner.
Type |
Method |
Processing Speed |
Examples |
Edit Points ... |
Curve |
|
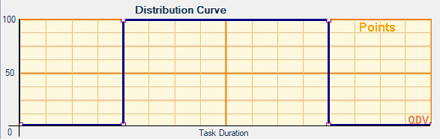
Points (piecewise) |
Enter coordinates. Points with x=0 and x=100 must always be defined. To modify before saving, click anywhere on the grid. |
Fast (math model) Max: 100 points |
Hat |
Point (x) |
Value (y) |
|
|
0,0000 |
0,0000 |
||||
|
|
25,0000 |
0,0000 |
|||
|
|
25,0000 |
100,0000 |
|||
|
|
75,0000 |
100,0000 |
|||
|
|
75,0000 |
0,0000 |
|||
|
|
100,0000 |
0,0000 |
|||
|
|
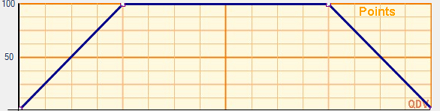
Trapezoid |
Point (x) |
Value (y) |
|
|
|
|
|
0,0000 |
0,0000 |
||
|
|
|
25,0000 |
100,0000 |
||
|
|
|
75,0000 |
100,0000 |
||
|
|
|
100,0000 |
0,0000 |
||
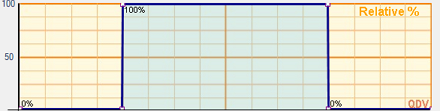
Relative % (stepwise) |
Enter in % the share of the rectangular area to come after each switching point. To modify before saving, click anywhere on the grid. |
Fast (math model) Max: 100 points |
Hat |
Edit Relative % ... |
|
|
|
Switching Point (x) |
Value (%) |
||||
|
|
|
0,0000 |
0,00% |
||
|
|
|
25,0000 |
100,00% |
||
|
|
|
75,0000 |
0,00% |
||
|
|
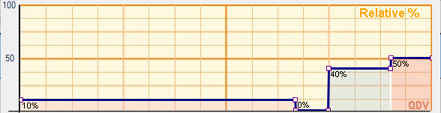
Stages |
Switching Point (x) |
Value (%) |
|
|
|
|
|
0,0000 |
10,00% |
||
|
|
|
67,0000 |
0,00% |
||
|
|
|
75,0000 |
40,00% |
||
|
|
|
90,0000 |
50,00% |
||
Graphic (freestyle) |
Click the anchoring points on the grid. in any order. QDV7 connects them with straight lines. |
Slow (no math model) Max: 520 X points, 180 Y points |
Lines |
– |
– |
|
|
Click the anchoring points on the grid in any order. QDV7 smooths the curve (continuous derivative function). |
|
Curve |
– |
– |
|
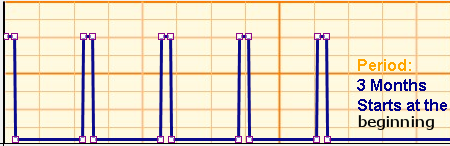
Peak |
Select New curve>Peaks. In the Cash Data sheet, QDV7 takes into account all the peaks that occur in the month. Used mainly with time frames: concentration of resources at regular intervals, e.g. for scheduled maintenance. |
|
Start at the begin. (if after 1 period, 1st peak is omitted in the schema) |
Edit curve |
|
|
|
To edit curve, click anywhere on the schema. The period can be smaller or larger than the main period defined in How to Create Time Frame Fields. Calculation rules: ▪a year has 365.25 days, a month has 365/12 days ▪If the time-frame sub-period is Month or longer AND the unit of the peak curve is Month or longer, the step is one month (with a planner, only the second condition is needed). |
|||||
NOTE The decimal zeroes are automatically added (up to 4 for coordinates, 2 for share in %).
The created curves are of Owner type.
A custom curve can be saved, exported as a qdvcurve file, and imported from another sheet or estimate. A new estimate does NOT inherit curves available in its master.