How to Fill the Time Columns in the Minutes |
  
|
How to Fill the Time Columns in the Minutes |
|
Prerequisites
▪A time frame has been defined (refer to How to Create Time Frame Fields)
▪Kind Ids have been set (and rates over time if times are used) in the overhead workbook (refer to Time Frame Sheets)
▪Specific columns have been inserted into the Minutes view (refer to How to Add Columns) in a convenient order:
For insertion, two parents are used:
▪<Time frame field name> Summary; it includes Kind ID, total cost per unit, total cost and, for Workforce, total time per unit, total time; optional columns include: time per basic unit (time unit /unit of the list), parameters, ...
▪<Time frame field name> < field name>; it includes values over time (Cost or Time per unit, Total Cost, Time Cost)
|
Summary |
Time frame of rates / factors provided by Overhead |
Time frame of costs/times/quantities to be entered |
||||||
Line number |
Kind ID |
|
|
|
|
|
|
|
|
A |
|
|
|
|
|
|
|
|
|
1 |
→ |
|
|
|
|
|
|
|
|
2 |
→ |
|
|
|
|
|
|
|
|
3 |
→ |
|
|
|
|
|
|
|
|
4 |
→ |
|
|
|
|
|
|
|
|
To quickly reach a column, right click a cell and select Go to column ...
The columns succeeding over time are inserted as one column and share one width.
The available columns depends on the Data Type. Some are mandatory for data entry, others are in read-only mode (total, rate, factor ,..). To force to 1 the factors of the row, set to 1 "Summary/No escalation".
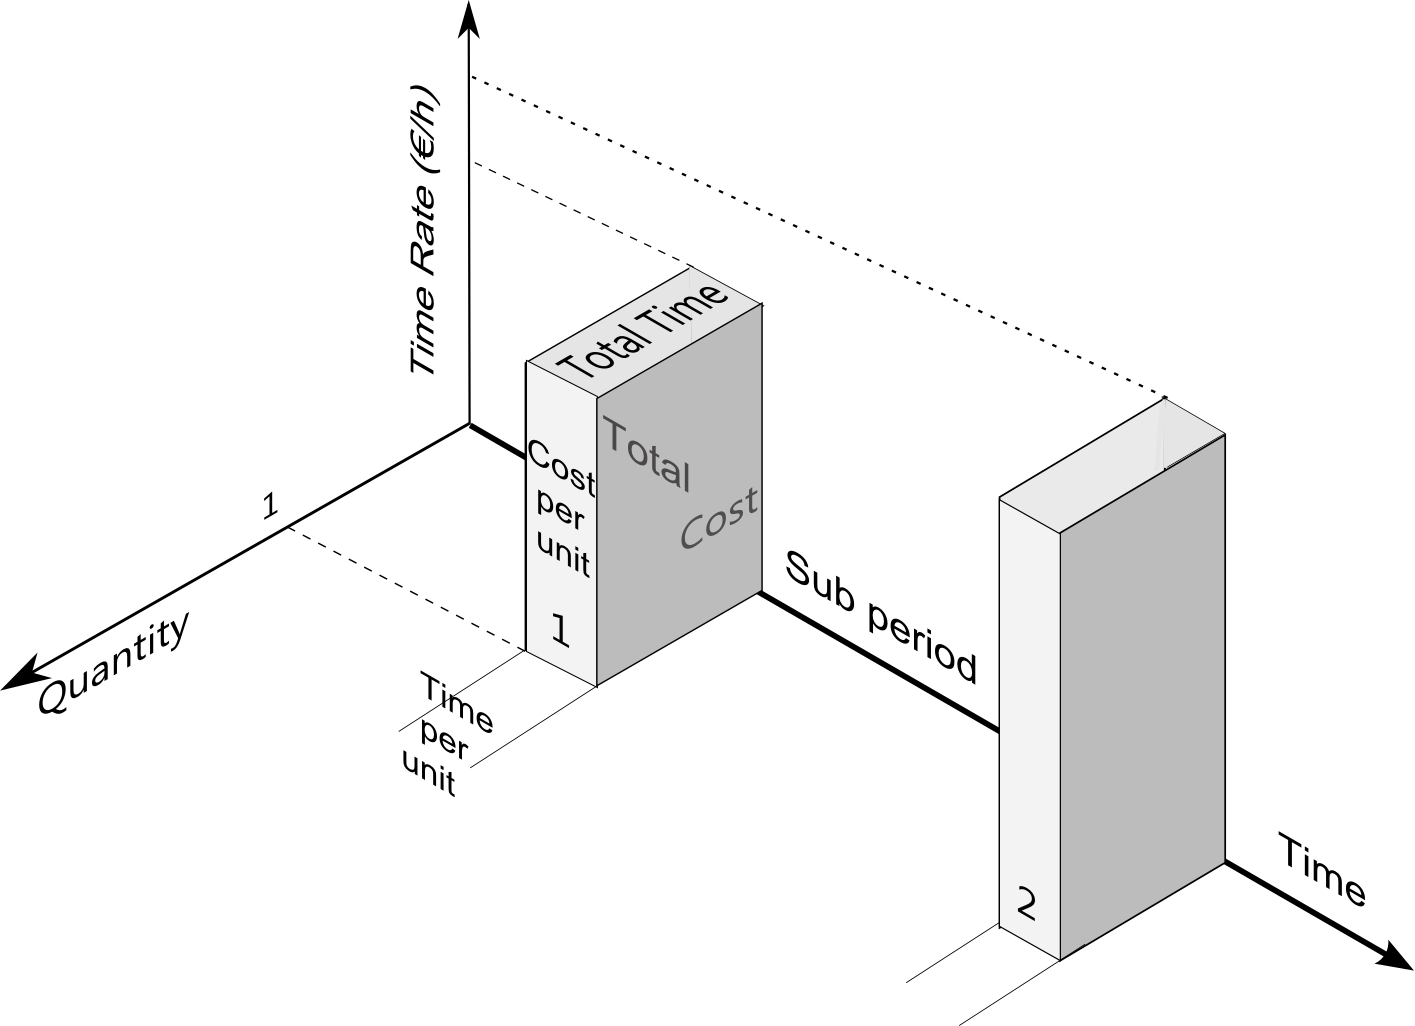
In the Summary distinguish:
▪Total Cost per unit: Σ Cost per unit over time
▪Total Cost: Total Cost per unit x Quantity
In the Minutes view, time-dependent Material/Workforce costs are kept apart from the regular Material/Workforce costs.
If both Material/Workforce and Time Frame Summary Kind Ids are defined, QDV7 adds the time-dependent Material costs to the regular Material costs, and the same for Workforce, BUT natively the addition displays only in the Overhead Summary sheet (cost column).
Once the costs and times per unit (and potential curves) have been entered, for better performance check the box File>Options>Calculations>Cost and time details for time frames. The related columns turn grayed and the values do not show.
Entry Without Curve
Enter the Kind Ids (double-click in the list) and cost/times per unit over time.
Click Refresh if required or Compute Costs if N/A shows in the cells; the time-frame and general Total Cost in the Minutes, and the values in the time-frame overhead sheet are refreshed.
DATA TYPE = TIME
As illustrated, two parameters vary over time:
▪the time rate per unit, which is entered in the overhead workbook
▪the time per unit, which is entered in the minutes view
The column Cost per unit is not available natively.
You Cost Only is a slave column of the Kind Id column. Its value 0 (blank), 1 or 2 is fixed in the related overhead sheet on a Kind Id basis (Time, Cost or Quantity respectively).
Cost/Time per unit is the only input in the Minutes view (with Cost per unit).
Depending on the Minutes, the columns "Rate or Factor" contain a rate or a factor, and the columns "Cost or Time per unit" contain a Cost per unit or a Time per unit.
With this Data Type, you cannot have workforce and material on one Minute. Use two Minutes.
Summary |
Cost/Time per unit |
Rate or Factor |
Summary |
||||||
Cost Only |
Time slot i |
Time slot i |
Total time per unit |
Total time (Hour) |
Total qty per unit |
Total qty |
Cost per unit |
Total cost per unit |
Total cost (estimate currency) |
|
Ti |
Ri |
Σ Ti |
qty x Σ Ti |
|
|
meaningless |
Σ Ti x Ri |
qty x Σ Ti x Ri |
1 |
Ci |
Fi |
|
|
|
|
meaningless |
Σ Ci x Fi |
qty x Σ Ci x Fi |
2 |
Qi |
Fi |
|
|
Σ Qi x Fi |
qty x Σ Qi x Fi |
C (input) |
C x Σ Qi x Fi |
qty x C x Σ Qi x Fi |
The overhead sheet allows you to assign different currencies to different Kind ID (as in a usual Workforce sheet); therefore the currency cannot be changed in the Minutes view as it can when the data type is Costs.
As a consequence, two columns are available:
▪Cost only = 0, Total Cost per unit (aka TotalCostPerUnitEst(imate)Cur(rency)), from which is derived Total Cost per unit (<currency of the estimate>)
▪Cost only = 1 or 2 : Total Cost per unit (<currency of the estimate>) from which is derived by multiplication with Currency rate, Total Cost per unit (aka TotalCostPerUnitEst(imate)Cur(rency)).
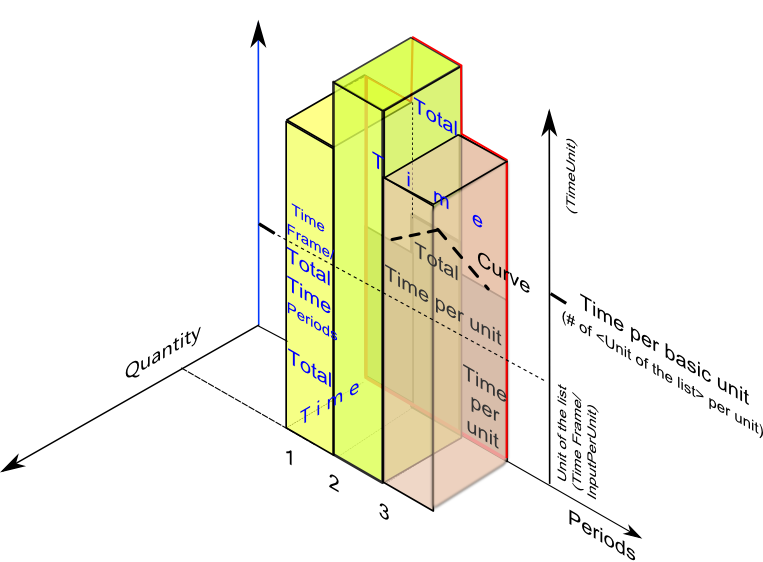
Extra specific columns to insert and fill out on a Minute basis:
▪Curve: distribution law over time (mandatory); click a cell to show the Overhead tab.
▪Start Period: sub-period from where the distribution actually starts on a Minute basis (rank in the time series)
▪Duration: count of sub periods across which the objective is distributed (decimal numbers are allowed); default value=1 (not displayed)
▪Instruction: identical to Summary/Total time per Minute if Cost Only =0; it is the Total Cost (before the negotiation factors are applied) if Cost Only =0
In the Summary, the Total Cost per unit equals to
▪if Cost only=1, Objective x average Factor weighed by the curve
▪if Cost only=0, Objective x average Time rate weighed by the curve (if Time per basic unit=1, see Description)
For details on the curves, open the third sample estimate and refer to Planner Data. You can create/reuse Custom Distribution Curves.
NOTE
The main periods in time-frame set of fields are not absolute. They are indexed on the start date of the time frame entered in the overhead sheet.
Example:
- main period: year
- sub-period: month
- start date: May 16, 2013
In the drop-down list, the first column in the Minutes is "May 2013" instead of "January 2013". The first main period ends in "April 2014" instead of "December 2013".