Planner (optional) |
  
|
Planner (optional) |
|
The planner adds a new dimension to the estimate: the frame of time on which the various tasks would be carried out.
The Gantt-style planner in QDV7 dynamically illustrates a project’s schedule: the start and finish dates of the terminal elements and summary elements of a project that comprise its WBS. Every task in the planner represents a job to be performed: studies, temporary housing for on-site construction workers, tests, etc., and may contain various elements coming from the WBS.
Unlike a task/chapter (package) of the WBS, a task/group (sequence of works) includes a time-span when the consuming Minutes must be achieved.
A Task may depend on other tasks. For example, temporary housing for workers must be completed before any work can begin on the onsite construction. QDV7 takes into account the fact that if the installation of the temporary housing takes more time, the start date of the onsite construction must be shifted, and QDV7 will recalculate the effect it has on the global cost.
A task in the WBS usually implies various tasks in Gantt; the link is done on the minutes level:
Line number |
Task in Gantt |
Description |
A.1 |
|
Switchgear |
1 |
Site works (electrical and automation) |
Cabinet |
2 |
Studies |
Drawings of cabinet |
3 |
Site works (electrical and automation) |
Cables |
Task = Switchgear Group = Site works
User Interface
To view the Planner tab, select in File>Options>Calculations the level where the tasks will be assigned. In addition, QDV7 inserts the sheet Planner data in the Overhead workbook.
The contextual menu or the keys Ctrl Shift F7 gives quick access to the Planner.
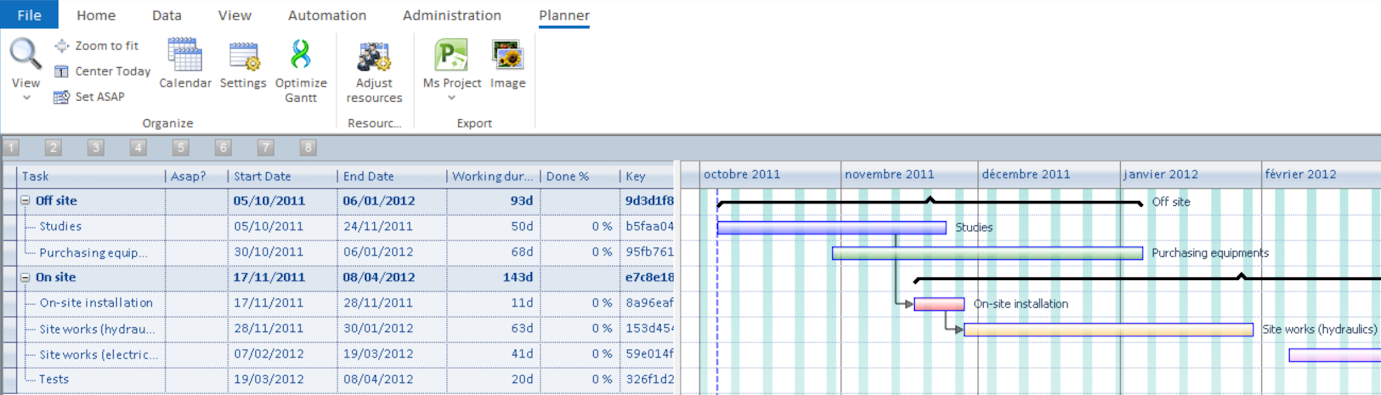
The planner sheet features:
▪A context tool tab (Planner)
▪On the left, the data, with a possible structure, for example to separate studies/procurement time (off site) and lead time (on site)
▪On the right, the diagram in mutual correspondence with the tasks; to replace the diagram with an extract of the minutes, double-click the related task bar (refer to Gantt Minutes); to restore the diagram, click the Planning tab:
To view the left part completely, drag the border to the right hand. Conversely, it is possible to replace the left part by tool tip.
The tasks are listed in the chronological order; the earliest task start and the latest task end define two blue vertical lines in the diagram (today is represented by a red vertical line); for the tasks in a group to stay together, the earliest task in the group imposes the group position.
To scroll vertically/horizontally, click in the left part/the diagram and roll the mouse wheel.
To postpone a task, edit the start date in the left part; QDV7 recalculates the end date to keep the duration.
To translate the whole diagram, click outside task bars (the caret turns into <°>), hold down the mouse left button and drag horizontally.
To shift a task/group, click the bar/bracket (the caret turns into a white big cross), hold down the mouse left button and drag horizontally. The rows are reshuffled to keep the earliest task on the top.
To shift a task start/end, select the bar, then the start/end edge (the caret turns into a black cross) and drag it horizontally.
To show/hide columns, right click in Tasks/Resources chart, and select Configure columns, then check/uncheck the field. To change the column order, click the button Move up/down.
Column |
Description |
Input allowed on the left side |
Analog viewing |
Icon/Picto |
Task type |
See below |
Input thru a drop-down list |
|
|
* |
Sums up the task properties thru icons (see below) |
Read only |
|
|
ASAP |
Task starts on the earliest time (regardless of the entered date); the start cannot be deferred graphically if another task is earlier |
Binary input thru a drop-down list |
|
<|= |
Milestone? |
Landmark without duration, no Done value |
Binary input thru a drop-down list |
|
x |
Working duration |
Duration in working days |
Direct input. Units: d=day, h=hour |
Bar length |
|
Done |
Percent already carried out before start |
Input thru a spin (step: 5%) |
Line length inside the bar |
|
Duration |
Total # of days between start date and end date |
Read only |
|
|
Owner |
Input thru a drop-down list |
|
|
|
Key |
Row id in error messages |
Read only |
|
|
SETTINGS
Select the icons eligible to show in the * column:
Setting |
Icon |
Description |
Priority |
! |
The task does not consume any resource |
Status |
V |
Done has been entered |
Overdue |
O |
Start date/time expired |
Alignment |
|
|
Happiness |
O |
Emoticon based on the completion % |
To create a Gantt diagram that reflects the Expanded WBS and its current degree of detail, you can use a macro as in the sample Exemple_Macro_WBS.
In the diagram part, select a task, right-click it and select:
▪Insert task, to add a new task. Alternative: bar Home>Edit>Insert Task in Gantt
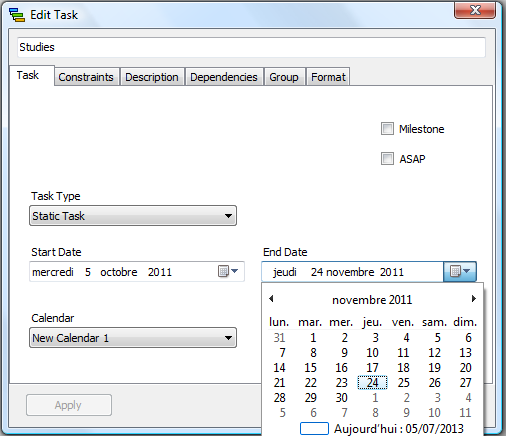
▪Edit task, to change the data
▪Insert group, to associate tasks in the structure, defined in the Group tab. Alternative: bar Home>Edit>Insert Group in Gantt
NOTES
- Up to 2,500 tasks + groups are allowed
- Entry can be done directly in the left part; if the end date is earlier than the start one, they will be reversed on price calculation
In the first field, enter the label to show in the Overheard workbook and the Minutes/WBS.
TASK
There are various types of task:
▪Static, defined by a start date and an end date; the duration is just the time difference
▪Fixed duration, defined by a start date and an overall duration (working days + days off); the daily working time can be extended to the full day. Derogation: to count only working days, check the box File>Options>Display>Planner-Data reports working duration (this is to keep older estimates as they are)
▪Fixed work
▪Fixed units
▪Hammock task, whose time frame wraps those of other tasks to select; this very selection defines the constraints and dependencies, and the duration of the hammock task; to have this function, check the box File>Options>Editing>Allow Hammock tasks; no constraint nor dependency can directly be applied to them
▪Milestone, defined only by a start date: the bar is replaced with a vertical blue line and a diamond.
To edit the types of task,
▪in the diagram, right click and select Edit task
▪or in the left pane, right click and select Configure Columns, check the box Task type and double click the cell.
CONSTRAINTS
Say there are two tasks A and B. Their constraint <>-<>, where <> is Start or End, reads as A<> precedes or equals B<>
End-Start |
A |
||||
|
|→ |
||||
|
|
|→ |
→ |
B |
→ |
|
|||||
Start-Start |
Γ |
A |
|||
|
|→ |
||||
|
|→ |
→ |
B |
→ |
|
|
|
||||
End-End |
|
A |
|||
|
|
|→ |
|||
|
|
|→ |
→ |
→ |
|
|
|
||||
Start-End |
|
Γ |
A |
||
|
|
↓- |
|||
|
|
→ |
→ |
→ shows the allowed B task translation direction.
DEPENDENCIES
The relation between two tasks can be:
▪Soft, that is loose; it is PREFERABLE that the following task waits for the completion of the preceding; this does not affect the bar position
▪Hard, that is imperative; the following task MUST wait for the completion of the preceding.
To start a task as soon as all the prerequired tasks are completed, regardless of the entered start date, check the box ASAP. To do this directly, right-click the column in the left part and select x.
GROUP
The group which a task can be enrolled in can be created when the task is inserted/edited (Group tab) or as an empty shell.
You can also populate the left part with Data>Import from Excel. If QDV7 cannot find dates, it assigns the current date as Start date, and 10 days as duration.
Diagram
Any selection in the diagram is repeated in the left part by an index on the far left (see general screen).
To access the data on the diagram through a tool tip, click the corresponding bar.
An arrow --↓ denotes a dependency, a horizontal bracket denotes a group.
To duplicate a task, click the source bar, then double-click the hatched outline.
To delete a task, click the bar, right-click and select Delete Task or Group.
To modify graphically a start/end date, select the bar left/right side and drag :
▪a cross-shaped icon results into an extension/contraction of the bar
▪a hand-shaped icon results into a translation of the whole bar.
To shift the diagram across the time-line, hold down the mouse right button and drag.
To supplement the start/end dates with hour and minutes, check the box File>Options>Display>Display columns for hours and minutes in the planner; enter values directly in these columns.
To zoom in/out horizontally, click View in the bar and select Zoom In/Out or roll the mouse wheel.
CONTEXT MENU
To edit several task at one time, select them with Shift or Ctrl held down, right click and select Edit task. If the selection contains groups, they are ignored.
To move the diagram over the time, select as follows and drag:
▪to move one task or one group, select the task or the group
▪to move all the tasks at once, select Select all (alternative: hold down the mouse left button in the diagram)
▪to move all the tasks except those in a group, click this group, and select Reverse the selection.
To delineate the current date with a red line, select Center today. To revert to the regular diagram, select Zoom to Fit.
To show a Summary, select Summary. The selection in the LEFT part determines the scope of the summary; if nothing is selected, the sheet is empty.
To retrieve a task using its name, right-click in the diagram and select Find:
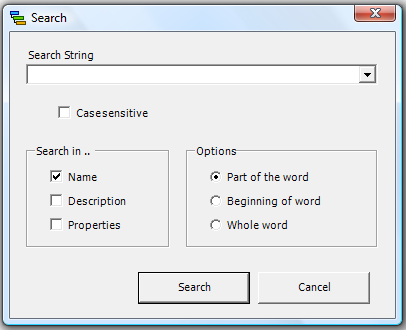
Enter a part or all of the name (specify it) and check the boxes and options.
Scroll across the matches selecting Find next or pressing F3.