Distributing the Values |
  
|
Distributing the Values |
|
Settings
COLORS IN SETTINGS>MAPPING TAB
The flag reads NON OK when the total of the assigned values differ from 100% (or from the value to distribute).
Three options when more than 100% of a value are assigned (in total):
▪Do not alert: NON OK does NOT change color
▪NON OK takes the special color
▪the value to distribute takes the special color.
For the new settings to be applied, close and reopen Excel.
The colors are detailed in Excel Shortcuts>Styles.
An under- or over-distribution does not block the process.
FREEZING
To freeze left-hand columns when scrolling horizontally:
1.Unprotect the workbook in Excel Shortcuts if needed
2.Select the last always visible column
3.Click View>Freeze Panes>Freeze Panes; a vertical dotted line shows.
Distributing the Values Across the Customer Items
1.Click Distribution>QDV→Cust.; this creates for each selected field in the WBS/OVH a sheet (MAPPING #1, 2 etc) featuring a crossover table whose only the grayed-green cells are editable (%); the field name is repeated in the D2 cell and its values are in the E column
2.Distribute the WBS value horizontally across the customer items (for Quantity in particular, switch from % to absolute value with the toggler in the ribbon to make it easier); when the value is exactly distributed, the OK flag replaces the NON OK flag if properly set in Settings>Mapping; on the upper level, the flag equals the AND of underlying rows flags. The values are carried backward into the Customer's BoQ.
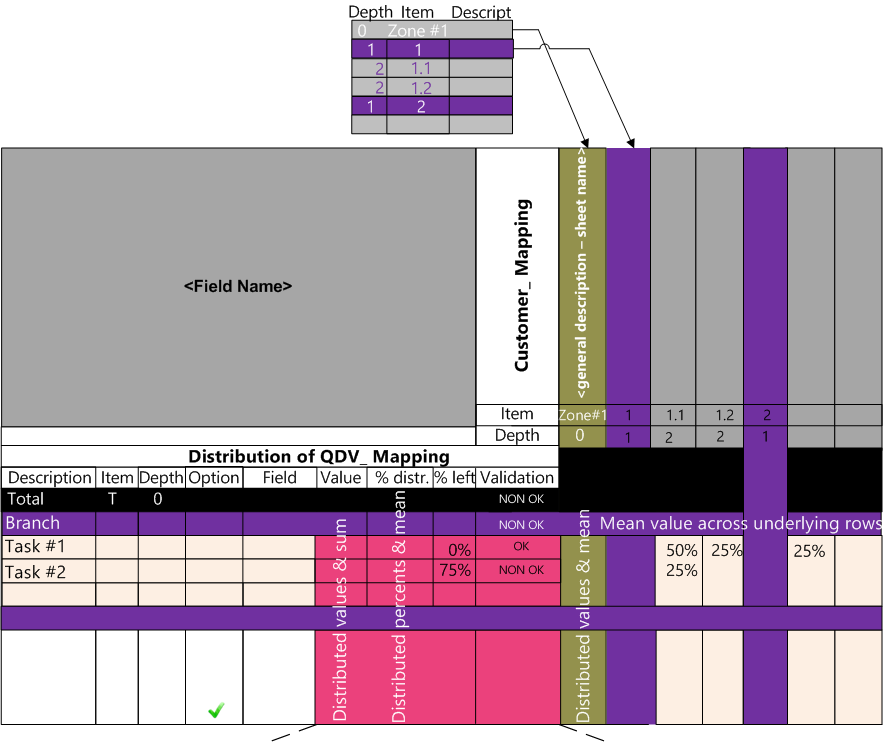
The four adjacent pink columns feature from left to right:
Root |
Sum of chapters values |
Average (Sum/count of chapters) |
|
AND of underlying chapters flags |
Section |
Sum of tasks values |
Average (Sum/count of tasks/centers) |
|
AND of underlying task/center flags |
Task/center |
Sum of distributed values |
Sum of distributed values |
% left |
Distribution status |
To hide the headings, click the – icons.
To exchange the Source and the Customer, click Rotate. The distribution is vertical.
Another sheet can be built with the other orientation; the Absolute value / % toggle status may be different.
![]() Select the orientation that best fits your screen; usually put the list with the greater count of items horizontally.
Select the orientation that best fits your screen; usually put the list with the greater count of items horizontally.
NOTES
- The new sheets show in the order Mapping #3, Mapping #2, Mapping #1 and are assigned to fields in the order in the list in step #2
- To propagate a value across a column, drag the bottom right corner.
- To evenly distribute a total across a range, enter the total percentage (or amount) in a cell, select the scope and select one item in the Distribution>Equalize menu:
▪Equalize: to distribute the entered value evenly across the whole row
▪Equalize on selection: select a single column or a single row; the distribution occurs only across the selection; to complete it, select other(s) cells and choose Reach the target value:
Percent left |
|
Before |
|
Method |
|
After |
|
|
|
X |
|
Equalize |
X/3 |
X/3 |
X/3 |
|
|
|
|
|
|
|
|
|
X |
|
|
Equalize on selection |
X/2 |
|
X/2 |
R |
|
|
|
Reach the target value |
|
R |
|
▪Branch Equalizer: after direct input of some customer tasks, select a last-level task (QDV task); in the dialog box, enter a percent for the customer WBS branch that shows; this distributes the percent evenly across the customer tasks; click the ⏷ part of the Equalizer button to select one in three methods; click the Equalizer button: this distributes the percent evenly across the underlying levels according to the selected method:
▪All cells: this overwrites the already manually entered values and populates evenly the empty cells
▪Proportionally: this adjusts the already manually entered values in proportion
▪Empty cells: this populates only the empty cells, keeping the already manually entered values.
NOTE By default, the percents feature no decimal.
Example: Equalization
- To try several distributions or recede along the way, save them as Datasets and recall them by their name by clicking the ⏷ part of the button (as long as the file is open, as they are not saved with the Excel file)
- To propagate a numeric series, input two seed values, select both cells and drag the bottom right corner
- Importing another Excel file locks the Mapping # sheets.