QDV Distribution Tool |
  
|
QDV Distribution Tool |
|
Use Case
To comply with the article 10.3.3 of CCAG Travaux 2009, a QDV7 estimate (or a part of it) must be provided in conformance with a particular Excel model that includes the Minutes and derives indirect costs by applying coefficients to the dry costs. More precisely, we must distinguish:
▪at Minute level, the dry costs, broken down into expenses for salaries, expenses for bulk materials and consumables, expenses for supplies
▪at task level, possibly broken down into shares:
▪the overhead costs in the one hand, the taxes in the second hand, both expressed as a percent of the dry costs
▪the margin for profits, expressed as a percent of the sum of dry costs, overhead costs and taxes.
There will be as many sheets in the worksheet as tasks. A summary including the quantities by task is not required. The model can be structured in chapters.
The simple cases where the corporate, sub-contracted and co-contracted shares must not be separated or have the same coefficients, can be addressed entirely in QDV7.
You must use QDV Distribution Tool if the estimate features corporate, sub-contracted and co-contracted shares, each with their own coefficients. This is common in:
▪trades finishing work
▪trades building system, infrastructures, or roads, ….
The indirect costs may be other than those mentioned in the article 10.3.3 (siteworks, overhead, ...) and the coefficients applied on other bases. This is exemplified in our examples.
Terminology
Using the tool does not require normally knowing QDV7. However, in the following we use rather the QDV7 native terminology, that is slightly different from the one of CCAG Travaux:
QDV7 ESTIMATE
Resources: the types defined for each set of columns of the overhead workbook:
▪Material
▪Workforce
▪sets of potential extra columns.
Each resource is identified by an ID, called key of distribution.
Meta Data:
▪the resources
▪the nodes of the WBS structure.
MODEL
Model: the imposed Excel frame; examples are provided in <Installation folder>\QDV 7\Samples\Stuff_4_QDVTools4XL. In the dialog, it is called Sheet to duplicate. Only the columns on the left of the First column of working zone will be published.
First row to duplicate: the reference row with the formulas; it will be replicated for each article.
Chapter: a collection of Minutes whose Kind Id are associated. Indeed the chaptering or Organization allows you to structure the Minutes according to a key values. Refer to the examples including a "structure". Do not confuse it with the pagination that will create as many sheets as selected tasks (and branches).
PROCESSING
Algorithms: calculation rules used to adapt the QDV7 estimate to the model. In addition to a formula, an algorithm includes at least an objective submitted to a solver (in Excel, the meaning is larger). By nature, these calculations require an heuristic with iterations.
Phases: succeeding states on the way to the resolution of anomalies.
Breakdown: final result of a generation; the distribution of a Line SP across several predefined columns; you can create an Excel database of articles, called Data set.. Thus you can load an algorithm and values of a previous breakdown to make sure identical article prices break down into identical values.
Principle
QDV7 discriminates the Minutes according the related Kind IDs. The goal is to replace these keys by up to 6 categories, for example:
▪Salaries and social charges
▪Consumables
▪Sub-contracting
▪Supplies.
This manual assignment reshuffles the material and workforce selling prices of each Minute according to these new columns.
This is like switching each SP to a column (Distribution):
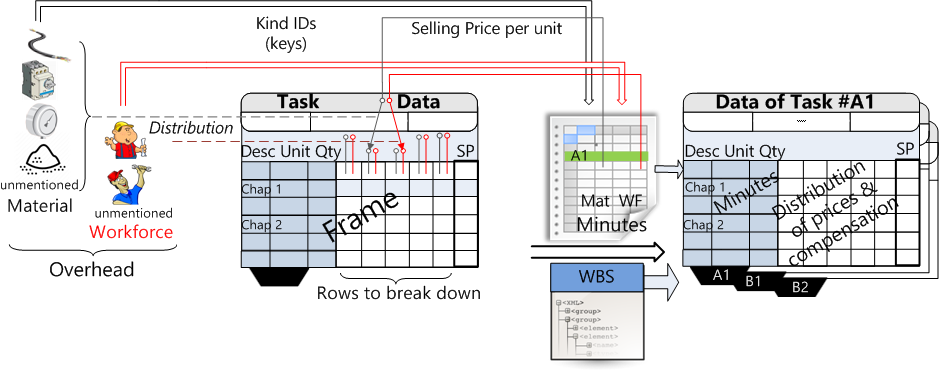
Opening QDV7 is NOT mandatory, BUT you are advised to compute all in the estimate at the beginning.
The way to the final estimate features 3 milestones:
Phase 1. Retrieval of QDV7 estimate data and application of the formula
Phase 2. Compensation and generation of anomalies if any
Phase 3. Generation of the final estimate or creation of a database of articles.
Estimate |
|
|
Frame |
|
Reduced Frame+Columns for tracing |
Final estimate |
||||||||
↓ |
|
|
|
|
|
|
|
|
|
↑ |
||||
1 |
2 |
3 |
4 |
5 |
6 |
7 |
||||||||
|
♡ |
|
|
|
1 |
2 |
|
2 |
3 |
|||||
Frame Excel file → |
LINK TO ESTIMATE |
IMPORT META DATA |
MAP FRAME |
DEFINE ALGORITHM |
DEFINE DISTRIBUTION & ORGANIZATION |
DEFINE SCOPE & PAGINATION |
TRIGGER PHASE 1 |
TRIGGER PHASE 2 |
TRAITER LES ANOMALIES (maybe change compensation) |
|
TRIGGER PHASE 3 |
→ Populated sheets |
||
Activating the Excel Add-In
Requisite: Excel 2013 or later.
1.In the QDV7 suite, open QDV Tools for Excel
2.Click Activate QDV Tools for Excel, then Close.
Opening and Preparing the Excel Model
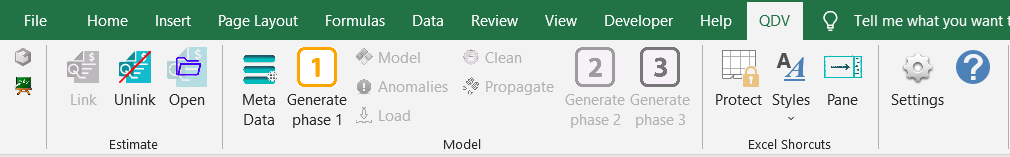
1.Open the model; in the QDV tab, select the Distribution app (easel icon on left hand):
2.if needed, enter the formula that calculates the Total SP in the Task Data top block and the formula that calculates the SP per unit in the reference row
3.if needed, enter the Coefficients value (estimating factors as in the QDV7 Sheet of Sales) and the formulas for computing (the cells containing the Coefficients may be defined later in the floating pane)
4.In Formulas>Name Manager, you can name the cells in the reference row to be used in the formula
5.Have an empty row after the reference row, and for the optional Organization, enter chapter rows
6.In the total row, the total columns must add the values of all preceding rows by a SUM(<range>) formula
7.In the zone where the coefficients are applied, for the base, refer to the totals in the total row (the references can be absolute or relative)
8.Enter any values in the reference row just test the formula.
![]() In the zone where the coefficients are applied, make sure not to have in one column both text and numbers.
In the zone where the coefficients are applied, make sure not to have in one column both text and numbers.
CAVEAT
- Dismiss the setting enabling computations to be done using the displayed values instead of the stored values
- Avoid functions other than SUM, MAX, and MIN; otherwise you will have to re-enter the formula in the tool.
![]()
- Format correctly the hosting cells
- For clarity, you may colorize the cells when direct or not input is necessary
- To lighten the formulas, set the cells hosting coefficients to Percent format
- In Advanced Options>'Display options for this worksheet' group, check the 'Show a zero in cells that have zero value' box.
Linking To An Estimate & Parameterization
![]() Make sure the cursor is NOT in the formula bar; otherwise Excel is waiting for a formula: the state bar reads Edit, instead of Ready, and a message pops up.
Make sure the cursor is NOT in the formula bar; otherwise Excel is waiting for a formula: the state bar reads Edit, instead of Ready, and a message pops up.
To set a link to the estimate, click the Link icon in the QDV tab.
Select the estimate (herein called the source); the icon fades out.
The window title turns to <Excel file name>[QDV-><estimate full path>]
Save the file.
To change the estimate, click Unlink and answer No to both questions.
![]() To help selecting fields in the lists, tag the fields of interest beforehand:
To help selecting fields in the lists, tag the fields of interest beforehand:
1.Select Estimate>Open and select the estimate
2.Click Compute All (Ctrl F5) and save (if omitted, the tool will do it in phase 1)
3.In both Fields Managers, select a (native or free) field of interest (SP per unit of a set of columns, SP per unit in free column)
4.Right click and select Show by default in the Excel tools; [SHOW_BY_DEFAULT_IN_TOOLS4XL] shows in the Comment column
5.Repeat and click OK.
![]() If two resources of two Set Sheets have one Kind ID, block the contribution of either by right click on the Total price field in the Fields Managers of Minutes and selection of Hide in Excel tools. (This reads in the Comment column.)
If two resources of two Set Sheets have one Kind ID, block the contribution of either by right click on the Total price field in the Fields Managers of Minutes and selection of Hide in Excel tools. (This reads in the Comment column.)
RULE OF THUMB To avoid differences, do not allow too many decimals in the WBS (File>Options>Rounding).
NOTE As the resources are the keys, make sure that most Minutes contribute to one or two types (whether they consume Material and Workforce or only one)
![]() The groups can be handled, but the calculations are erroneous with free fields and quantities different from 1. Therefore insert fields per unit, e.g. COTRAIT_PVUNIT_QENT instead of COTRAIT_PVTOTAL_QENT.
The groups can be handled, but the calculations are erroneous with free fields and quantities different from 1. Therefore insert fields per unit, e.g. COTRAIT_PVUNIT_QENT instead of COTRAIT_PVTOTAL_QENT.
Select Settings>Distribution. The displayed configuration is the latest used by QDV Distribution Tool (but the link to the estimate must be set ).
![]() To predefine the Options in the floating pane:
To predefine the Options in the floating pane:
▪"Descriptions in list": check "Show descriptions (i.e. names) instead of code (Kind ID) in list"
▪"Only default columns": check "In lists, use default columns (i.e. marked) to reduce the size of lists"
▪Conditional exclusion of Minutes' rows : select the column whose values will be tested against the specified value.
The Settings>Distribution tab allows you to define a watermark indicating the phase number ("phase state'), and a description for the adjustment row created to solve some anomalies.
For the new settings to be applied, close and reopen the Excel file.
Importing the Meta Data (il not done yet)
Click Meta Data. This reads the estimate resources.
Mapping the Frame
MAPPING (Settings tab)
The meaning of the fields in the Task Data top block must be indicated to the tool.
The meaning of columns in the Minutes view must be indicated to the tool.
Refer to Mapping the Frame.
ASSIGNING THE KIND IDs (Distribution tab)
Select in the drop-down list a column for breakdown.
Select in the list from the estimate an ID whose selling prices must be aggregated in this column; tip it into the reception area. If needed, repeat with other IDs.
Repeat with the other columns for breakdown.
![]() Save the parameters regularly.
Save the parameters regularly.
Generating Each Phase
DEFINE THE ALGORITHMS
Refer to Generating Each Phase.
ASSIGNING THE KIND IDs (Organization tab)
SELECTING THE SCOPE & PAGINATION (Selection tab)
Check the tasks of interest. You can mix branches and tasks as in the schema of principle (A is a branch, B1, B2 are tasks, etc).
GENERATIONS
Refer to Generating Each Phase.
Example without Organization
The Coefficients in the model are not overwritten as no value is entered in the pane:
Details