Charts |
  
|
Charts |
|
Histogram of a 2-column range
Define a range with at least a numerical column (refer to Range of Cells) and remember the name (it can be retrieved, in edit mode, in the Names combo box in the upper left corner).
To insert a chart, as in Excel™, in a user sheet of the Overhead workbook or an in-row sheet of the Minutes:
1.Switch to Edit Mode
2.Right-click the starting cell and select Insert control>Chart
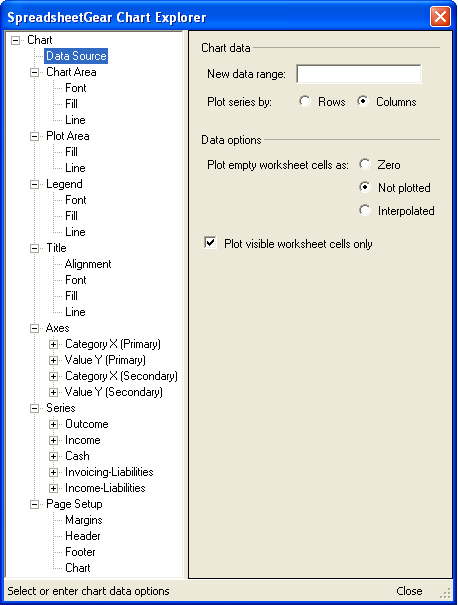
3.Right-click the blank chart and select Chart explorer
4.Enter the range name in Data Source>New data range, and press Enter
Result:
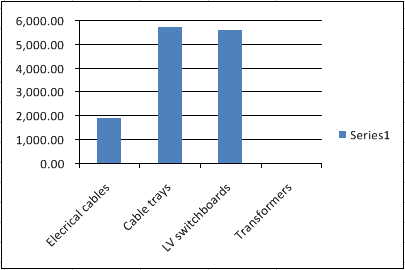
To move the chart, drag it.
To enlarge/shrink the chart, pull/push using a handle. The text is not transformed.
NOTES
- If the range has three columns, the third one is rendered by colors and numbers 1, 2 etc. Plotting series by rows can be a better option
- For cash-flow curve, refer to Cash Flow Curve.